The Hertzsprung-Russell (H-R) Diagram
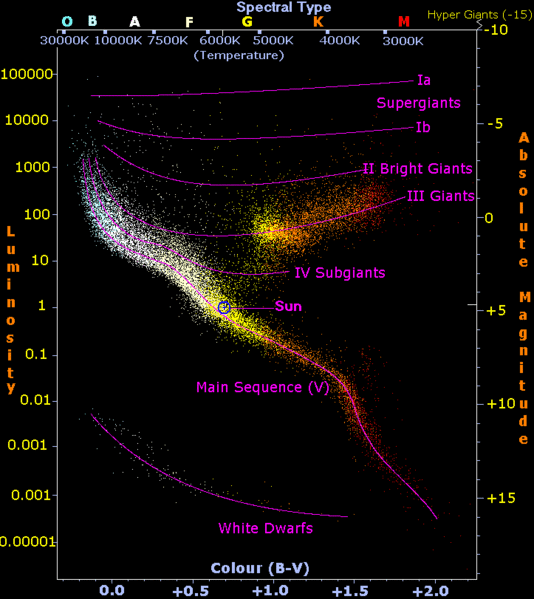
The Hertzsprung Russell diagram plots the Luminosity of stars against against their temperature. This gives us a lot of information about how stars develop throughout their lifetime.

The Hertzsprung-Russell Diagram, attribution: Richard Powell
Danish astronomers Ejnar Hertzsprung and American astronomer Henry Norris Russell independently discovered the correlation between the luminosity and the star's colour.
Along the x-axis, the colour of the star, temperature and spectural type. One thing to note is that the temperature scale is written so higher temperatures are to the left of lower temperatures. The spectural class is the related to the temperature and is classified by a letter. The spectral classes are O B A F G K M. (A good way to remember this is with the mneumonic: 'Oh Be A Fine Girl Kiss Me'.
Along the y-axis, the luminosity or the absolute magnitude
Stella evolution takes place over a period of billions of years, but just as we could deduce the life cycle of tree by looking a lots of trees, forrest we can see trees at all stages of their life, observing many stars allows us to draw conclusions about the life-cycle of stars.
Main Features
The majority of stars fall along a diagonal line across the chart. This is known as the main sequence. Our own sun is on the main sequence.
Other types of star can be seen on the H-R diagram. The red-giants are large they are quite luminous but their temperature is low so they are in the top-right of the diagram.
White dwarf stars are hot but very small so they are in the lower-left corner.
Evolution of Stars
How do stars evolve with time?
